
Invest in the future.
Next 15 is the only marketing and technology group built at the intersection of data, AI and activation. We combine specialist businesses operating in the fastest-growing markets - Retail Media, Data & Research, Digital Transformation, Marketing and Communications, and Creative Services - unified through shared platforms, proprietary data and AI embedded in real client work. Unlike traditional holding companies, we deliver measurable outcomes, not just outputs, transforming how the world's leading brands grow.
A transformed portfolio.
Under new leadership, we have sharpened our strategy and tightened our portfolio, exiting non-core assets and focusing capital on businesses that meet our criteria for capabilities, categories and commercials.

Portfolio criteria.
Next 15 invests in business that demonstrate:
Strategic capabilities
Strong, defensible, and accessible data assets; proprietary technology products; and measurable client outcomes driven by data and technology.
Market Leadership
Strong or leading positions in AI-enabled growth markets.
Financial strength
Repeatable organic growth, high competitive margins, and strong cash flow generation.
Category leaders
Retail Media (10–15% CAGR). Data & Research (15% CAGR). Digital Transformation (13% CAGR). These are not emerging sectors, they are proven, growing, and we hold strong positions within them.
Financial highlights.
as at 15 April 2025/FY25.
£448.8m
Net revenue
15.1%
Adjusted operating profit margin
44.4p
Adjusted diluted earnings per share
£63.4m
Adjusted profit before tax
£617.3m
Statutory revenue
£(0.1)m
Statutory operating (loss)/profit
£50.9m
Net cash inflow from operating activities
15.35p
Dividend per share
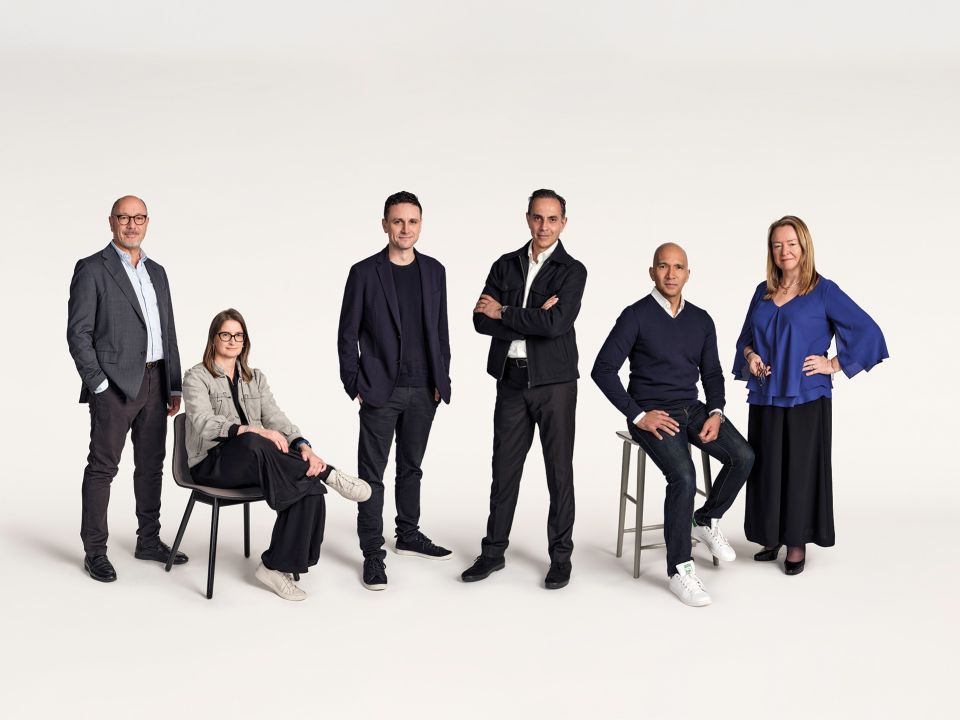
Latest from leadership
Watch the leadership team set out the strategy in full — Capital Markets Day, January 2026.
Data and AI is reshaping how the world's leading businesses grow. Data moves faster, AI is rewriting the rules, and clients need partners who can turn complexity into competitive advantage. That's where NEXT15 comes in.
Sam Knights, CEO
Annual Report 2026
Understand Next15’s performance over the last 12 months and how, under new leadership, we are building a simpler, stronger Next 15 fit for the opportunities ahead.
Key highlights:
Net revenue: £448.8m
Adjusted operating profit: £67.6m
Margin 15.1%
Revised portfolio
New operating model: five segments, three-track classification
Transform: best year in its history
M Booth Health: significant H2 growth; momentum continuing into FY27
CMD January 2026: strategy and medium-term targets set
Corporate governance.
The Board is committed to the highest standards of corporate governance and intends that the Company should comply with all requirements of the QCA Corporate Governance Code.
See all pages in this section:


Subscribe to our investor alert service.
To receive an e-mail whenever we post new financial information about the Company to the site, please subscribe to our investor alert service.